
- 48
- 679 067
Geosearch International
Spain
Приєднався 31 бер 2020
Hi, my name is Andreas de Jong and on this channel I publish educational videos on hydrogeology, hydrology, GIS & data management. I am a freelance consultant in water resources management & associated capacity building of institutions. I will try to answer your questions in the comment section underneath each video, so please don't send me any emails.
How to download FREE daily weather data from 120,000 stations worldwide (GHCN-Daily)
In this video I will show you how to download FREE daily weather data from over 120,000 stations worldwide. The data is called the Global Historical Climatology Network - Daily which abbreviates to GHCND and it is hosted by the National Centers for Environmental Information, which is part of NOAA. The available data includes daily temperatures, precipitation and snow data. I’m going to show you four different methods to find the stations and download the data:
⇨ No.1 Online map viewer
⇨ No.2 Google Earth
⇨ No.3 QGIS
⇨ No.4 GHCND Excel tool which I have developed
************** Resources ****************
► Link to this GHCN-daily video: ua-cam.com/video/zqdvILGSFEg/v-deo.html
► Link to Excel GHCN-Daily tool & Manual on Google Drive: bit.ly/GHCN-Daily_XLSX_Tool
Click on the download arrow (top right) to get the file.
Chapters
00:00 Introduction to free GHCN-daily weather data
00:43 Online Map Viewer Method
04:39 Google Earth Method
06:53 QGIS Method
14:51 Excel Tool Method
24:02 Final remarks
Disclaimer: This is an educational video & part of the Excel for Water Resources course. This video is based on open source data & the purpose is to train you in QGIS & Excel. I am not responsible for what you do with this information/methodology. You need to check you own data, work and conclusions.
Переглядів: 4 202
Відео


How to install SAGA in QGIS - No Binaries needed
Переглядів 3,4 тис.4 місяці тому
Recent versions of QGIS don't have the SAGA tools installed. In this video I'll show you how to get SAGA working again in QGIS, without having to get the binaries from Sourceforge.net. This video is for QGIS in Windows. Mac is a different story... there is a separate chapter in the manual which describes the proceedure. Chapters 00:00 - 00:19 Introduction 00:19 - 00:44 Install Processing Saga N...

Hantush Pumping Test Analysis in Leaky Confined Aquifers
Переглядів 2,7 тис.10 місяців тому
This video is about the Hantush-Jacob (Walton) non-steady-state method of pumping test analysis in leaky confined aquifers. We will briefly look at the theory of leaky confined aquifers, some relevant references and free online books and resources and then I will show you how to analyse some pumping test data using a free Excel tool. Links to UA-cam Videos Theis: ua-cam.com/video/YMcRRIe4iAg/v-...

How to create a ClimateEngine Account
Переглядів 546Рік тому
In this video I'll show you how to create a Climate Engine.org account. Thanks to @doostdoost-wz5zt for this very relevant question!

QGIS: How to create a groundwater contour map using the Thin Plate Spline (TPS) Interpolation
Переглядів 18 тис.Рік тому
In this video I will show you how to quickly and easily interpolate a large groundwater level dataset using the *QGIS Thin Plate Spline (TPS)* Interpolation tool. We will create a smooth raster of the static water level data of the Tapi River Basin of India, and then create contour lines and groundwater flow direction arrows. Finally we will save the contours to a GeoPackage file and print a ma...

Excel: How to calculate the Seasons & the Water Year
Переглядів 1,8 тис.Рік тому
In this video I will show you how to calculate the Season and the Water Year (Hydrological Year) in Excel from any date. We will be using the Month(), Year(), Lookup(), and IF functions. I'll introduce you to the theory, and then apply it to a practical example from India where we will use the CHIRPS daily precipitation from the Tapi River Basin of India to add the Season and Water Year as meta...
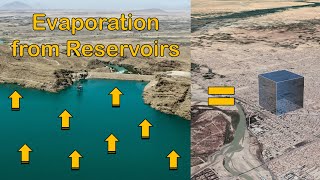
How to estimate Reservoir Evaporation Losses using free data - Kajaki reservoir, Afghanistan
Переглядів 6 тис.2 роки тому
Did you know that the amount of water lost to evaporation from all the reservoirs in the world is estimated to be greater that the total global domestic and industrial water demand? So why is this important loss of water from reservoirs not addressed more often in river basin plans, or the cost-benefit analysis for new dams? The main reason is that it is difficult to accurately calculate the ev...

Excel: Reservoir Storage Monitoring from Elevation & Area - Kajaki Reservoir
Переглядів 2,6 тис.2 роки тому
How do we calculate the volume a reservoir if all we know is its surface area or the elevation of the water level? In this video I will show you how to do this in Excel, using polynomial formulas. We will be working on the Kajaki reservoir, Afghanistan using the elevation-area-storage curves we calculated in the previous videos. Chapters: 00:00 Introduction 00:44 Copy data table 01:07 Insert El...

QGIS: Reservoir volume from DEM - Kajaki Reservoir, Afghanistan
Переглядів 13 тис.2 роки тому
How can I find the volume of a reservoir or lake from a DEM? In this video we will calculate the elevation-area-storage capacity for the Kajaki reservoir, Afghanistan from the SRTM30 DEM. We will use data from a 2006 bathymetric survey, which used an arbitrary datum, to find the elevation-volume relationship below the SRTM30 water mask, and then combine the two data sets together in Excel. I wi...
Excel: How to add a 2nd Axis to a Chart - Reservoir Elevation-Area-Storage Capacity Curves
Переглядів 4,3 тис.2 роки тому
How can I add a second horizontal axis to an Excel chart? In this video we will build the elevation-area-storage capacity chart for the Kajaki reservoir, Afghanistan with the reservoir area in hectares shown on the secondary horizontal axis in reverse order. We will use data from a survey carried out in 1968 by the USGS. I will take you step-by-step through the processing of the original data t...
Excel: How to fix date format problems - Text to Columns, Concatenate & more
Переглядів 8 тис.2 роки тому
Why does Excel not recognise some dates as numbers? How can I fix it? In this video I'll show you how to break up badly formatted dates using Data - Text to Columns, and how to stitch it back together using the CONCAT() function. We will format it is a table and finally produce a quick line chart of the data. Chapters: 00:00 Introduction 00:16 Check if data is number or text 01:14 Trick to chan...
Happy New Year 2022 & thanks for your support in 2021!
Переглядів 2762 роки тому
Hi my name is Andreas. As the year 2021 comes to a close I want to use this opportunity to say thank you to all of you who've helped me to build my channel this year. I'd like to say thank you to the 2 700 new subscribers who hit that subscribe button to join my channel this year! You've viewed my channel 130 000 times, you come from 93 different countries, and one of you is watching one of my ...
Snow Covered Area & Water Resources - Kajaki Dam Catchment, Afghanistan
Переглядів 1,1 тис.2 роки тому
The Snow Covered Area (SCA) can be used to predict upcoming floods & droughts during the irrigation season in Central Asia. In this video I will show you how to download and process SCA data from Afghanistan to predict the floods of 2019 and 2020 and the droughts of 2018 and 2021. We will be using the 500x500 metre resolution MODIS MOD10A2.006 dataset. It will be processed in AppEEARS to give u...
Snow Water Volume & Water Resources - Kajaki Dam catchment, Afghanistan
Переглядів 9372 роки тому
Snow water volume (SWV) can be used to predict upcoming floods & droughts during the irrigation season in Central Asia. In this video I will show you how to use the Snow Water Equivalent (SWE) maps and SWV data from the USGS FEWS-Net website to better understand the 2021 drought in Afghanistan. We will use the Kajaki Dam catchment in Helmand Province to compare the available water resources sto...
Introduction to Snow Monitoring in River Basins (Snow Water Equivalent & Snow Covered Area)
Переглядів 1,7 тис.2 роки тому
Introduction to Snow Monitoring in River Basins (Snow Water Equivalent & Snow Covered Area)
Evapotranspiration: Download FREE daily MODIS ET/PET over a catchment in AppEEARS & process in Excel
Переглядів 15 тис.2 роки тому
Evapotranspiration: Download FREE daily MODIS ET/PET over a catchment in AppEEARS & process in Excel
Introduction to MODIS Evapotranspiration (MOD16) - a free global dataset of ET & PET
Переглядів 8 тис.2 роки тому
Introduction to MODIS Evapotranspiration (MOD16) - a free global dataset of ET & PET
TOR & BOQ of water wells - Hydrogeology 101
Переглядів 3,7 тис.3 роки тому
TOR & BOQ of water wells - Hydrogeology 101
Climate Engine: Download FREE Daily CHIRPS precipitation data over a catchment (drainage basin)
Переглядів 32 тис.3 роки тому
Climate Engine: Download FREE Daily CHIRPS precipitation data over a catchment (drainage basin)
QGIS 101: Extract the Streams - Mapping catchments & streams from DEM - Part 3 of 3
Переглядів 3,5 тис.3 роки тому
QGIS 101: Extract the Streams - Mapping catchments & streams from DEM - Part 3 of 3
QGIS 101: Map the Catchment - Mapping catchments & streams from DEM - Part 2 of 3
Переглядів 3 тис.3 роки тому
QGIS 101: Map the Catchment - Mapping catchments & streams from DEM - Part 2 of 3
QGIS 101: Prepare the DEM - Mapping catchments & streams from DEM - Part 1 of 3
Переглядів 7 тис.3 роки тому
QGIS 101: Prepare the DEM - Mapping catchments & streams from DEM - Part 1 of 3
QGIS 101: Georeferencing maps using satellite images
Переглядів 2,9 тис.3 роки тому
QGIS 101: Georeferencing maps using satellite images
Hydrogeology 101: GeoVES - Free 1D VES inversion for groundwater exploration
Переглядів 23 тис.3 роки тому
Hydrogeology 101: GeoVES - Free 1D VES inversion for groundwater exploration
Hydrogeology 101: Introduction to Resistivity Surveys
Переглядів 85 тис.3 роки тому
Hydrogeology 101: Introduction to Resistivity Surveys
QGIS 101: Cubic Spline Interpolation of static water levels
Переглядів 5 тис.3 роки тому
QGIS 101: Cubic Spline Interpolation of static water levels
QGIS 101: How to load layout templates (2)
Переглядів 11 тис.3 роки тому
QGIS 101: How to load layout templates (2)
QGIS 101: Contour Lines from 30m DEM
Переглядів 10 тис.3 роки тому
QGIS 101: Contour Lines from 30m DEM
Google Earth: KML File Creator - How to export locations from Excel to Google Earth
Переглядів 13 тис.3 роки тому
Google Earth: KML File Creator - How to export locations from Excel to Google Earth
Hello sir is their any complete course offered on Hydrogeologist and any suggest books please sir Your explaination is extraordinary ways I loved it sir keep explain all remaining topics sir please
Hi Sardar, I have not seen any good free hydrogeology courses. That is the reason why I am making my videos. One resource you should look at is the groundwater project: gw-project.org where you can find many free books for download. All the best, Andreas
This helped me, thank you.
You are welcome! All the best, Andreas
You make me fall in love with to ground water exploration ......thankyou
Groundwater exploration is great fun. Glad you enjoy it! All the best, Andreas
Thankyou❤❤❤
You're welcome Surafel! All the best, Andreas
Thanks you, very clear
You are welcome Algassimou! All the best, Andreas
Hi, can I use this for one borehole only (no observation well)?
Hi Don, yes it is possible to use it with pumping well data & you use the borehole radius as "r". However, you should ignore any storativity values calculated in this way. For that you need observation well data. All the best, Andreas
Hey andreas it's me sana Rehman.
Hi Sana, welcome to the channel! All the best, Andreas
Thank you, this was extremely useful.
@with_ny8178 thanks for your kind words! All the best, Andreas
very good, an appreciable true method and true instruments for groundwater Exploration
Thanks for your kind words! Yes, the old fashioned tools never go out of fashion, and often better and more reliable especially in remote areas. All the best, Andreas
Thanks a lot for sharing such a valuable lecture ❤
You are welcome Hakmatyar! all the best, Andreas
Thank you for such a clear explanation
@syedahmedshah4402 you are welcome! all the best, Andreas
Thanks for this lesson, it is very helpfull.
You are welcome! All the best Andreas
Does Darcy's Law apply to both confined and unconfined aquifers?
Yes, Darcy's Law applies to all groundwater flow. All the best, Andreas
Is it compatible with Windows 11? Thanks.
Hi Berham, yes it works but you need to leave the file in its original XLS format. Do not save it in XLSX or XLSM format. All the best, Andreas
@@GeosearchInternational Thank you so much
@GeosearchInternational I have another question, please, Mr. Andreas... Do you have any research topics regarding applications of 2D ERT for my master thesis? I appreciate your help... Thanks.
Hi Berham, ERT is quite expensive and time consuming, so usually it is used if you need to get detailed information over a small area. I have used it to map faults & landfills... other applications include archeological sites, graveyards, and areas which will be excavated such as the entrance to tunnels. I would advise that you meet with your local municipality or local companies, and see if any of them have some needs for a detailed imaging of the sub surface. You never know - maybe they can sponsor you as well. Wish you all the best, Andreas
@GeosearchInternational The insights you provided are very useful... thanks again.
HI.. How to I do I use this to calculate ET in a 10m by 10m area?
Hi Swanu, you could try to extract data using a point location, but remember that MODIS uses a 500x500 metre pixel sizes, so you will get an average number for ET/PET over that pixel... and it will only give you data if that pixel has some vegetation. All the best, Andreas
Thank you for very clear explanation.
You are welcome! @nataliiabudeniuk2193 All the best, Andreas
"storativity is defined the volume of water that an aquifer releases from storage per unit surface area of aquifer per unit decline in the component of hydraulic head normal to that surface." sir this is the definition of storativity. If it is a volumetric term then how come it is unitless without any unit as cubic cm or litres ?
Hi Swayam, storativity is unitless: m3/m2/m... Maybe better explained in the Storativity video. Of course we can use it to calculate how much water will be released by an aquifer based on the area and drop in hydraulic head. All the best, Andreas
sir we know that water is at greater than atmospheric pressure in the confined aquifer. Similarly what will be the pressure of water in an unconfined aquifer ? will it be equal to t or less than 1 ?
Hi Swayam, by definition groundwater will be at atmospheric pressure at the water table. Below the water table the pressure will increase by about 1 bar/1 atmosphere every 10 metres of depth due to the weight of the water. All the best, Andreas
@@GeosearchInternational thank you sir !!
Welcome!
Great presentation. Can you please suggest reference books to study it more. Thanks.
Hi Attaur Rahman, My knowledge is mostly via more experienced geophysicists and several years of field geophysical surveys for groundwater exploration. I always found the books to be very theoretical but not so useful for field surveys. I think there are already some books on geophysics in the Groundwater Project, but not sure if it's about conventional geophysical surveys. Have a look at: gw-project.org/books/?_books_categories_facet_filter=investigation-techniques I'm planning a new video on field techniques for resistivity surveys... but am very busy. All the best, Andreas
@@GeosearchInternational many thanks. Please do share some stuff on bore well logging as well.
In the link I sent you I saw a book on geophysical borehole logging. There is also a book by the IAH which can be downloaded free: iah.org/wp-content/uploads/2013/03/IAHbook_ICH9.zip
Sir, I am student of geology. Can you suggest some good books that shall help understand hydrogeology clearly. Books that have a bit simple language to decipher 😢
Hi Swayam, have a look at the Groundwater Project. They have just released their 50th free book on groundwater: gw-project.org/books/ All the best, Andreas
Sir kindly make a video on piezometric surface
Have a look at the first video I made on this channel: ua-cam.com/video/O7K00PQaQIw/v-deo.html All the best, Andreas
Could you please make a video how to analysis ET data from usgs earth explorer in arcgis by using zoinal statistics
@Eng.Shihabalbalushi, I have been using ESRI ArcView/ArcGIS since 1999, but nowadays I use exclusively QGIS because it is all I need... so my GIS videos are only for QGIS. Regarding ET data I'm using MODIS ET/PET with 500m resolution. Normally I get the time series since 01/01/2000 - see: ua-cam.com/video/cUAtYyGI9mI/v-deo.html. I'm also going to start using FAO WaPOR, since they expanded the dataset to Asia. What exactly do you need to do? Make a map of ET? All the best, Andreas
Thank very much ❤
You're welcome! All the best, Andreas
Cool, very helpful. Data download at just 1 click.
Thanks Nawaz! All the best, Andreas
please which software did you use
Hi Ibrahim, the presentation is PowerPoint and the Excel tool uses VBA to calculate the Theis curve. All the best, Andreas
Thanks for such a wonderful explanation 😊
You are welcome abhishek! All the best, Andreas
What is the best season to do the resistivity survey? Is it pre monsoon, monsoon or post monsoon?
I would pick the season when the climate is the best, because it is difficult to work in the heat. During the monsoon your work will be interrupted by rain/thunder, so I guess the post-monsoon would be the best time. There is also the issue of the soil. If it is already wet, the current can enter more easily. However that can be mitigated by pouring water on the electrodes. All the best, Andreas
Thanksss, you helped me a lot <3
You are welcome Ayrem! All the best, Andreas
Could you please provide best notes for hydrogeology sir
In all my videos you can have a look in the description, where I often share files. For this video there is a Link to pdf notes: bit.ly/3e86loF all the best, Andreas
Can I plot superposition of q_0 + q_well in order to find the distance of the 50 day line ragarding traveltime. I did this in an confined aquifer. But I don't know if I can use the same matlab script for unconfined aquifer.
Hi Tom, sorry I cannot advise you as I don't know the method or the equation which you are using. In any case you need to be very careful with the main input parameters T, K, i, effective porosity, presence of other wells, boundary conditions etc. All the best, Andreas
Thank you for your reply. I solved the equation analytically. It turned out that dupuit-thiem for confined is also for phreatic aquifer if the drawdown is beding corrected by Jacob 1963 equation since it uses the piezometric height relatively to the distance R and und constant pumping well discharge. It follows the law from Darcy. The analytical integral relstes therefore only for the radius. All the rest ist a constant value. The radius is replaced by x and y cartesian system using the Pythagoras and the rule for the rectangular triangle relationship of the intercept theorem.replacing the r the formula can be used for x and y as distance to the well. The integral of derived function leads to the traveltime formula along the center line to the well. tau=-x-ln(1-x) using this formula along the axis includes the downstream speed of the ambiant groundflow as a superposition with the velocity induced by the well pumping rate. This formula gives the information at which point the particle along the y achses and about the traveltime. With this the d50 line can be calculated. Its valid for confined aquifer. But also in phreatic aquifer as long as jacob 1963 drawdown correction is applied. I finished the program with matlab and i wrote the analytical induction that the approach is legitimate. If Ur interested id send you the script and the solution. This is probably the analytical and numerical core of modflow except that modflow uses more information input. But still the derivation of the above formula is the heart piece of any hydrological approach for the traveltime
Hi Tom, you should double check your output with a numerical model just to be sure. It’s so easy to make programming errors. Here is a good overview of different methods for capture zone delineation: www.envirolink.govt.nz/assets/Envirolink/R6-2-Capture-Zone-Delineation-Technical-Report.pdf all the best, Andreas
That is brilliant thank you big time. This is exactly what I was looking for.
You are welcome! All the best, Andreas
Fantastic SIr
Thanks so much! All the best, Andreas
Thanks so much! All the best,Andreas
Thank you sir...
You are welcome Robert! All the best, Andreas
I have an Electrical Geophysical field trip tomorrow, and can you imagine, I am here and trust me, it helped a lot to understand the practical knowledge and I'll let you know tomorrow, how it goes. Thanks a bunch for this beautiful lecture.
Hi Akash, thanks so much for your kind words & good luck with your field trip! All the best, Andreas
Thank you for this great video. A short and less stressful way of getting the data into excel is to open excel, click on data, go to get data, then copy and paste the URL, select the table you need in this case table one and click load.
Thanks for your kind words @chesko7753! You are right - power query is very good at extracting data from various sources, but it is also quite complicated to use when the input table is in a wrong format, so it is not the topic of this video. Only a properly formatted excel table will load correctly in QGIS and that is the message I’m trying to get across. Many people I meet are still trying to load CSV files into QGIS when there is a better way, and I hope that they go for this methodology. All the best, Andreas
What about the unconfined aquifer!!!!!
Hi Assia, sorry I do not understand your question. can you elaborate? All the best, Andreas
@@GeosearchInternational What about a partially penetrating well? The same steps?
Hi Assia, if your observation well is close to the pumping well you will need to correct the observed drawdown data for partial penetration effects. However, I would always do the first interpretation without any corrections & then compare later. You can find more details on partial penetration corrections here: www2.alterra.wur.nl/Internet/webdocs/ilri-publicaties/publicaties/Pub47/Pub47-h10.pdf All the best, Andreas
@@GeosearchInternational Thank you for your efforts and quick answers
@@AssiaTafrount-vw4jq you are welcome! All the best, Andreas
The website to download the ground water data is very painful. Has anyone else found it's so slow it's practically unusable?
Hi Mark, are you referring to the India Water Resources Information System? indiawris.gov.in/wris/#/DataDownload You can try to get the data when it is night time in India. Good luck & all the best, Andreas
@@GeosearchInternational Hello thanks for the quick response. Yes the data from the India Water Resources Information System. I'm finding the website very slow to work with. I'll try again at a different time.
Hi Mark, yes, it has not easy. If you want a time series of the water levels, you need to download the data by State and year separately. After that, there is no unique identifier for the wells so you need to create one. I concatenated State-District-Station to make one. There is also a way to access the data using python script, but I have not tried it. All the best, Andreas
I am so glad to see your videos, but why you select Kajaki Dam for your working area?
Hi Atiqullah, Kajaki is the most important dam in the Helmand River Basin & also there are some interesting studies already completed by the USGS. I wanted to see if they can be replicated using open source data. For example, see my video on the evaporation losses of Kajaki dam. All the best, Andreas
I think the results for your volume is 5100 MCM which is a large number compared to the actual reservoir capacity 1700 MCM.
Hi Habib, the maximum capacity @ 2 metres above the spillway is around 1485 MCM. That is an SRTM elevation of 1020m, or an arbitrary project elevation of 1035.5m. When we make the Elevation-Area-Capacity curves we will always include elevations which are way above the maximum fill level. In this case I have gone up to 1050m SRTM, which would give a volume of 5063MCM. Of course this is just theoretical. The reason for extending the curves is in case some politician decides that it would be a good idea to increase the dam height by "x" metres. I think there were some plans to do this for the Kajaki. If the curves are ready, it is very fast to see the impact of this in terms of flooded land area, and increased evaporation losses from the larger surface area of the reservoir. All the best, Andreas
Hello! I tried to follow your instructions for the mac version, but SAGA doesn't appear in the toolbox. Am I missing a step do you think or is it a bug?
Never mind! Solved! It was an error with the filepath! Great video, thank you!
Hi Brette, glad it worked! All the best, Andreas
A useful video!
You are welcome Thomas, all the best, Andreas
Simply excellent lecture!
Thanks Monim! All the best, Andreas
Works well! Thanks.
You are welcome Dan! All the best, Andreas
Excellent content. How do saline aquifers affect the data readings in your experience? How to go about this survey in such cases?
Hi Anwar, Saline groundwater has a higher conductivity - ie lower resistivity than fresh groundwater. A higher clay content has the same effect, so you need to be careful with the interpretation and it is always good to have calibration wells. I have used resistivity surveys to map the fresh - saline interface in coastal aquifers. The change in resistivity is really clear. Usually the currents don’t penetrate much into/below saline groundwater so it may affect the depth of investigation. All the best, Andreas
Thank you for sharing your invaluable experience, Andreas.
@@anwarmaqsood9764 you are welcome! All the best, Andreas
How can I get your excel file?
The link should be in the description below the video. All the best, Andreas
Hi! Thank you for your video. I'm in the middle of trying to follow your advice, but I was just wondering: Is the SAGA Gaussian Filter not available anymore on QGIS? Couldn't manage to find it (I'm using Qgis Maidenhead, the latest version up to date).
Hi Inga, yes SAGA has disappeared but there is a way to link to it. Please see links below. The video is for QGIS windows, but I also included instructions for Mac in the manual. All the best, Andreas ► Link to Manual (PDF): bit.ly/Install_SAGA_in_QGIS_WIndows ► Link to video: ua-cam.com/video/ceBOzPtQvms/v-deo.html
I followed the steps as described, but there is a slight error in Excel. I do not have a file like Template I want help with this
Hi Mazen, All files links are in the description below the video. Have you downloaded the template? Link to the Excel template & data files: bit.ly/3C1himE Link to updated template for 2000-2022: bit.ly/MOD16A2GF_template_zip All the best, Andreas
This is great, how do i get the excel for this calcs?
Hi Fred, the links to files are always in the description below the video: QGIS shape files & Reservoir DEM: bit.ly/3Lc70Ws EXCEL data & calculations: bit.ly/3unSTaz It opens in Google Drive so just click on the download arrow top right. All the best, Andreas
Thanks, got my homework done
You are welcome Xogen, All the best, Andreas
Hi! I would like to ask what other sources can we download a raster data?
Hi Phii, there are so many different types of data so it depends what you are looking for. In QGIS there are also many plugins which allow you to download rasters directly. e.g., SRTM Downloader. all the best, Andreas
We want a video about the difference or which is better between the magnetic method or the electrical method to detect groundwater..thanks from Iraq
Hi @assoaljomaily1589 there is no method to detect groundwater directly, except perhaps with magnetic resonance. The magnetic method is looking for changes in the earth's magnetic field so you can use it it you are looking for e.g., igneous dykes if you want to site wells just upstream of them. By electrical method you are probably thinking of resistivity which is the best way to map aquifers. You can use resistivity profiling, resistivity imaging, VES and also electromagnetic methods like TDEM. You can find several videos on resistivity & groundwater exploration in my Hydrogeology 101 playlist. All the best, Andreas
@@GeosearchInternational thank you Mr Andreas ..I have many friends who want to dig wells, but the nature of the layers is gypsum and karst layers, and it is difficult to find water everywhere, and when we dig more than one well, we do not find water except by luck. So one of my friends suggested that he buy a device to detect groundwater from a depth of 10 - 70 meters...that's why I asked you...knowing that I major in geophysics
@@assoaljomaily1589 If you are only interested in shallow wells (<70m) you could try resistivity traversing followed by VES. Karstic areas of limestone will have a lower resistivity so maybe you can map them. As for gypsum, do you have any low quality water in that formation? All the best, Andreas
@@GeosearchInternational array (VES)@@GeosearchInternationalarray @@GeosearchInternational high condictivity@@GeosearchInternational
I've just grasped the distinctions between permeability and hydraulic conductivity, as well as the concepts of Darcy flux and groundwater velocity from the video. Thank you immensely for the clarification. Your video is impeccable in every aspect, from theory to slides and explanations. It's undoubtedly the top lecture on basic groundwater flow on UA-cam.
Thanks so much for your kind words @hydromanor! Glad you found it useful. All the best, Andreas